Shop owners often have two prime factors guiding their business philosophies – where do the cars come from and where can I get the parts? Taking a step back from the micro level of analysis on how these questions affect you can often reveal some interesting facts about how they affect the industry.
In June 2021, IHS Markit released its annual estimate of vehicles in operation and the age of those vehicles. One was a new record and one was a retreat.
The new record was set by the average age of light vehicles in operation. The IHS estimate for 2021 indicated an average vehicle age of 12.1 years, which is an increase of two months over last year’s forecast. The retreat was in Vehicles In Operation, or VIO. That number decreased from 281 million vehicles in 2020 to 279 million vehicles in 2021. According to IHS, that is the first decline in VIO since 2012.
Sales Slump
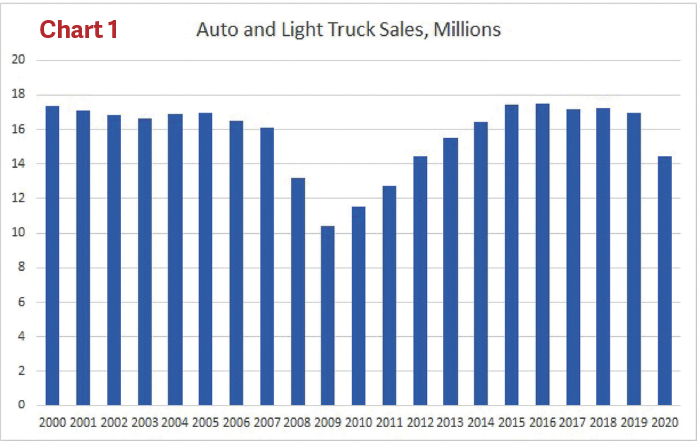
One easily measured economic time series can be cited as a culprit for both movements reported by IHS. That culprit is the decline in new vehicle sales in 2020. For the year, new auto and light truck sales were 14.436 million, the lowest level since 2012. Using an online data base such as TrendLens from the Auto Care Association (https://trendlens.autocare.org/) or FRED from the Federal Reserve Bank of St. Louis (https://fred.stlouisfed.org/), we can easily make a chart (Chart 1) that tracks annual or monthly auto sales. While the final sales figure for 2020 probably exceeded many forecasts made at the beginning of the lockdown, nonetheless 2.5 million fewer new cars were added to the nation’s stockpile in 2020 than had been added in the previous five years. That will cause both a shortfall in VIO as well as an increase in the average age of the vehicles.
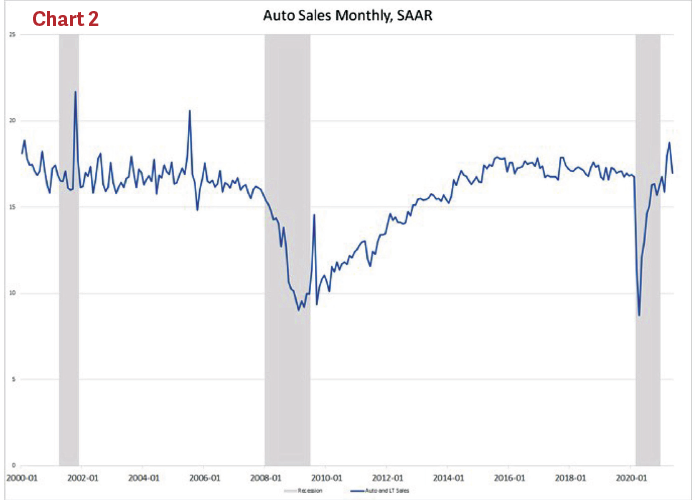
If you are keeping track of sales, note that monthly auto sales are often reported at a “seasonally adjusted annual rate.” Annual rate refers to how many vehicles would be sold in a year if that month’s sales pace kept going for a whole year, while seasonally adjusted means that some attempt was made to smooth out known fluctuations that occur in sales during the year. Looking at it in this way adds a whole lot more volatility to the chart. It also points out how different this recession was compared to the last recession
The shaded areas in Chart 2 indicate economic recessions. As you can see, the plunge in sales that occurred during the lockdown matched in-depth the plunge that happened during the Great Recession of 2008-2010. However, as soon as the lockdown ended sales snapped right back, unlike the Great Recession, when sales stayed low for many years. The Great Recession was caused by massive financial problems that started in the housing sector – thus, it took a long time to get right. The latest recession was caused by restraints put in place to meet a non-economic problem, and when those restraints came off, the economy wasted no time in coming back.
The Sweet Spot
Looking back at auto sales from years past also brings to light some good news for the aftermarket. Many industry observers cite something called the “aftermarket sweet spot” that is made up of vehicles that are variously described as six to ten or six to eleven years old. These are vehicles that are out of warranty, entering the time period where OE equipment needs replaced, and the vehicles are still young enough that the owners are going to do more than just the bare minimum to keep them on the road. The number of vehicles in the “sweet spot” today are the ones that were produced six to eleven years ago. Chart 3 is just the annual sales data we showed earlier, only the period of six to eleven years ago is highlighted in green. (Green happens to be the color of money, but that is just a coincidence.)
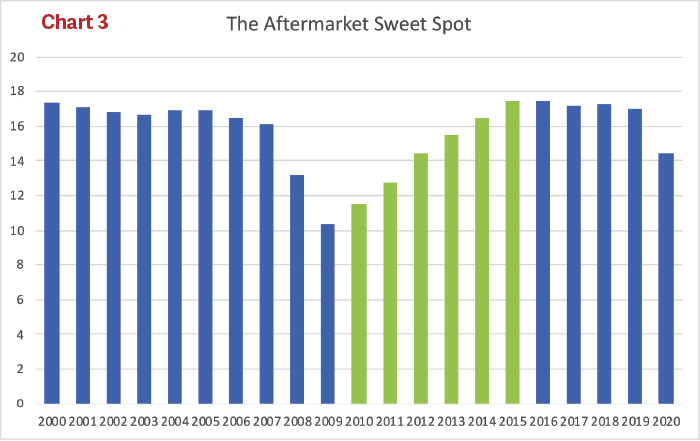
What this chart readily shows is that the number of vehicles in the “sweet spot” for the past couple of years has been heavily influenced by the new vehicle sales slump that occurred during the Great Recession. It was not till 2014 that new vehicle sales exceeded the level in 2007. After that, there were five years of very high new vehicle sales (2015-2020) that are just getting old enough to be in the “sweet spot.”
As another way of looking at it, Chart 4 shows, for any given year, the number of new cars produced six to eleven years before. I call that the maximum size of the sweet spot, for in reality not all those cars produced six to eleven years ago are still on the road. Some were totaled in accidents, and some may have been scrapped due costly mechanical problems. But the maximum will at least give us directional movements in the size of the “sweet spot.”
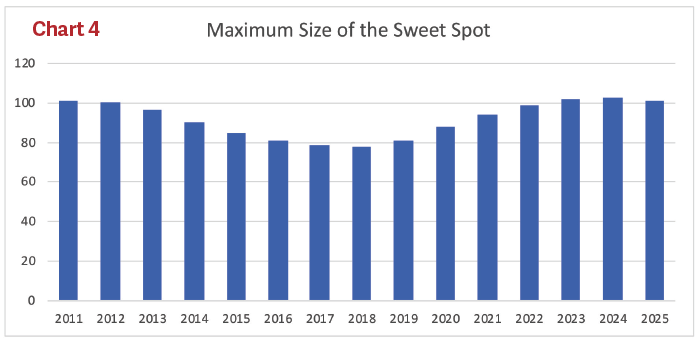
The “sweet spot” bottomed out in 2017-2018, as the full effect of the Great Recession sales slump took effect. But starting in 2019 and peaking in 2024, one by one those years of low sales will be replaced by years of high sales, and the number of vehicles in the “sweet spot” will grow. The drop in the maximum size of the “sweet spot” in 2025 is because of the drop in 2020 sales. Of course, anything beyond 2025 depends on future sales (So let us hope that computer chip shortage is solved.).
Medium and Heavy Sales
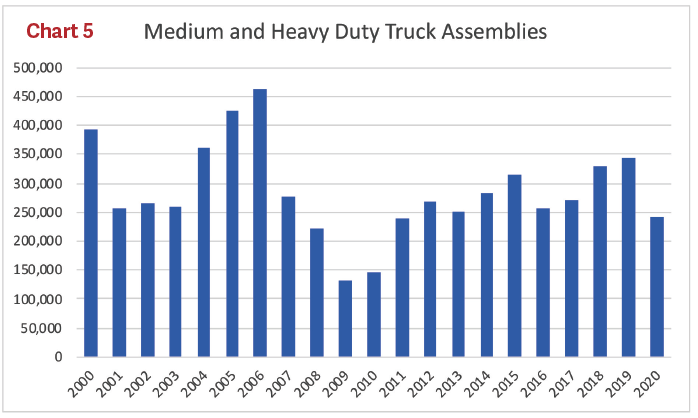
All the data above looked at light vehicles – automobiles and light trucks, with the latter including SUVs. What happened to medium and heavy-duty trucks during the lockdown? Medium and heavy-duty truck assemblies show more volatility year over year than is shown for light vehicles.
As Chart 5 indicates, the drop in 2020 was almost 30% compared to 2019. The drop was magnified by the fact that 2019 had been the strongest year since 2006.
You can read more about these vehicle numbers from IHS at news.ihsmarkit.com.
Where The Parts Are
We spend a lot of time studying the parts-ordering process by automotive technicians because it is a crucial portion of the automotive aftermarket. During 2021, Babcox Media conducted its biennial profile of independent repair facilities. Among the questions we ask in this survey “Where do you buy parts?” and “How do you buy parts?” This always provides interesting details of parts inventory and supply.
A key question that we ask in the IRF survey is “Please think about all the replacement parts you order in a given month. How much do you estimate you are getting from each of the following sources?” while constraining their answers so that they sum to 100%. The results (Chart 6) reveal that just under a half of their orders going to traditional program groups and slightly more than a quarter going to the retail chains.

What’s remarkable about these results are how unchanging they are when we compare it to the last time we conducted this survey, in 2019. When comparing 2019 to 2021, the only category that had more than a one percent change was New Car Dealers, which went from 13% in 2019 to only 11% this year. The dealer’s loss was split among the Retailers and the Internet-only sites, who each gained one percent. (These differences between 2019 and 2021 are all within the margin of error for these surveys.)
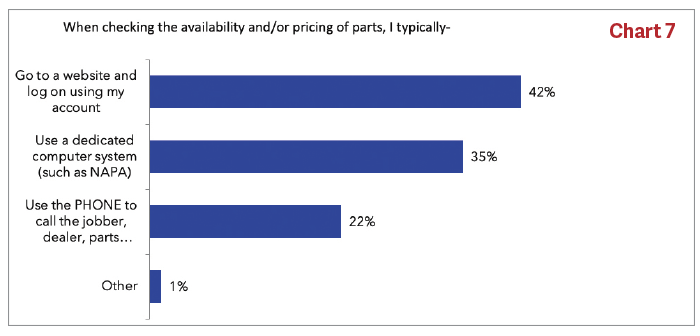
In addition to where parts are sourced, we asked HOW shops purchase parts.Another thing we asked in this survey was how they ordered their parts
As highlighted in Chart 7, In the 2019 survey, the percentage who said they used the phone was 36% – so shops have been hanging up the phone and booting up the computer as phone use dropped to 22%. The biggest growth was in the use of dedicated computer systems, which was only at 26% at the last survey, while the computer/website method gained four percent over this period.
We also compared how often the technicians would specify a particular brand of replacement part for their vehicle, compared to how often their customers specify a brand. As Chart 8 shows, the technicians are much more brand-specific than their customers.
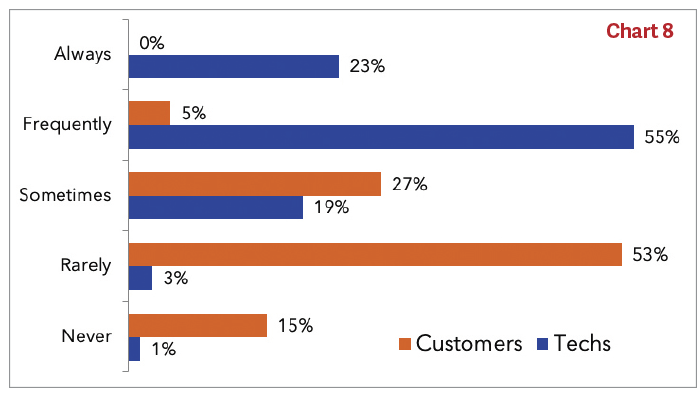
Technicians “always” or “frequently” specify a brand 78% of the time, while customers do so only 5% of the time – and no one said that customers “always” specify the brand. On the other hand, half of our technician respondents say that over two-thirds of their customers “rarely” or “never” specify a brand.
For information about parts category purchases by brand, visit counterman.com. For more information about the vehicle numbers from IHS, visit news.ihsmarkit.com.