By Uwe Kleinschmidt, CEO, AutoVitals

With the increasing ability to collect data electronically, shop owners are sitting on huge piles of data relating to various facets of shop operation. What are the best ways to comb through the data and determine the metrics that describe the productivity and efficiency of your business and allow you to impact it?
Since looking at raw data often covers up the real trends and is highly time consuming, business owners should be looking for ways to:
1. Define the metrics important to run the business;
2. Know what values represent the range between “below expectations” and “outstanding performance;”
3. Select the low hanging fruits, which promise the best bang for the buck results in the short term; and
4. Explore new metrics, which are made possible through better methods of capturing data.
Inspection Reports
With the introduction of digital inspections, new types of reports are possible. What was once hidden, or extremely hard to get, is now obvious and can be used to determine:
Technician effectiveness; and consistency of inspections.
Let’s take a look at a snapshot of a technician effectiveness report from one of our clients. See Chart 1.
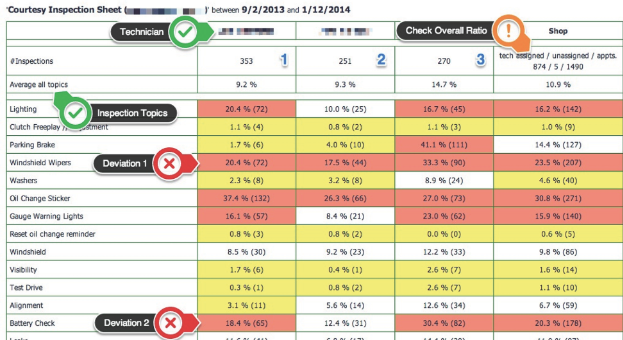
This report lists by inspection type, technician (here 3 techs sanitized to 1, 2 and 3) and what percentage of topics inspected resulted in a recommended action.
Let’s start with the overall shop numbers. Out of 1,490 appointments in three months, 874 appointments included a courtesy inspection.
The shop owner can immediately assess whether his or her policy of performing courtesy inspections is followed or not.
The next potentially interesting conclusion is whether or not the habit of pencil whipping (the repeated checking off of inspection topics without performing an inspection) is present for any or all technicians.
If it’s a habit, a significant number of inspection topics would show consistently low numbers of recommended actions. If this is not the case, it indicates that the techs are motivated to perform the courtesy inspection.
Now let’s explore individual inspection topics for individual technicians.
Windshield Wipers: Tech 2 recommended only half of the recommended actions, compared to Tech 3 (see Deviation 1).Battery Check: Tech 2 recommended only a little more than one-third of the number of recommended actions, compared to Tech 3 (see Deviation 2).
Assuming both technicians inspect the same Year/Make/Model (YMM) and odometer readings across the board, there is clearly a different quality standard for Tech 2 than for Tech 3. The shop owner can now determine the difference and adjust accordingly.
One way of finding out the reasons for the significantly different values might be the tech’s attention to detail or procedures used. The time needed for the inspection plotted for both techs might reveal great information about the root cause of the difference. It definitely shows:
• The consistency of time taken for the inspection; and
• The trend of whether policy changes or the introduction of new tools changes the duration of the inspection.
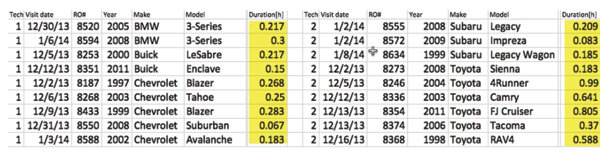
See another portion of a different report in Chart 2, which lists technicians’ time needed for an inspection sorted by YMM and technician. Note that the technician doesn’t need to clock time for the inspection. The software on the tablet used for the inspection automatically detects periods of activity and inactivity and determines the correct duration.
Filtering by technician and YMM allows owners to compare each technician’s inspection efficiency, and filtering by YMM allows owners to compare duration by YMM.
As you can see, this is just the start of finding meaningful data trends, enabled by digital inspections. Techs’ adherence to policies can be monitored, and highly efficient technicians can be used to set standards for all technicians in the shop or group of shops.
Motorist Retention Rate
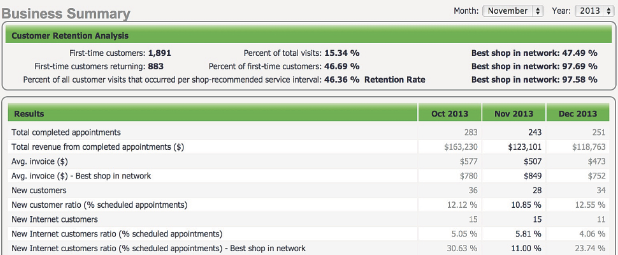
Another very important area of reports, with tons of data and different definitions, is the customer retention rate. See Chart 3 for a business summary that determines the retention rate and other important metrics for a shop’s business.
Initially, two very important metrics are listed for the shop in question:
1. How many first-time customers visit the shop as a percentage of total visits, and how many of those return for a repeat visit?
2. How many of the repeat customers follow the shop’s advice for preventive service intervals? We call that the retention rate.
As shown in the chart, these numbers are really put in context when compared with a reference or goal, like with the results of the best shop in the network. The best shop is not one shop based on all metrics. It’s the best result per metric combined together to represent “the best shop in the network.”
Compared over hundreds of shops, these reference metrics become a real guide for the individual shop owner who wants to improve his or her business.
The next level of detail is comparing key business metrics per month. These key metrics contribute to the retention rate. By breaking them down per month and also comparing them to the best shop in the network, seasonal trends can be eliminated (e.g., the lower number of new customers in November due to Thanksgiving, etc.) and concrete conclusions for one’s shop are possible. Positive (or negative) trends represent the results of the measures taken.
Uwe Kleinschmidt is the CEO and founder of AutoVitals in Santa Barbara, CA. The company’s Web-based services focus on the independent automotive repair industry. AutoVitals’ products facilitate highly effective Concierge Auto Repair services, covering all aspects of the service advisor’s interaction with prospective and existing customers. Highly effective and optimized websites, workflow support in the shop, as well as customer retention and social media services are just a few ingredients. He can be reached by visiting www.autovitals.com or calling 1-866-949-2848.